Post by Xarious on Jan 9, 2017 23:11:08 GMT -5
Ever wonder what all the pretty colors on this thing mean? Don't know how to even turn it on? Well look no further, all your answers pertaining to the lagometer can be found here!
What's this?
Lagometer is a box on the side of your screen that monitors all lag the player may encounter, both client-side and server-side. The best definition would be to say it measures the amount of delay a player experiences. It can be activated by opening the console and typing /cg_lagometer 1.

Yea, that thing.
It is separated into two main parts, by a blue line that reflects your FPS: The top, which interprets server-side lag, and the bottom, which interprets client-side lag.
What does it mean?
Well, lets start with the basics.

For starters, the green bar is a direct measurement of your ping. Ping, being the speed of information travel from your computer to the server. The higher your ping, the higher the green bar will be. The green bar can be affected by anything that changes the rate at which packets travel from your end to the server's end. This means commands like /rate, /cl_maxpackets, /snaps, /cl_timenudge, /cl_packetdup, and pretty much anything else along those lines. Some of those, like cl_timenudge, will not necessarily alter your ping on the tab list, but will alter your green bar. This is because timenudge alters the way the packets are perceived, not the rate that they are sent and received.
Obviously, then, if your green bar is shaky like that first picture, your connection is choppy. If you experience spikes in this green bar, you are having lag spikes on your end. A high bar means you are encountering high ping, and a low bar means low ping.
Next up is the red bars in the bottom section. Those suggest that the packets being sent are getting lost. You're losing these packets. That usually results from a poor connection with the server; it can be an issue on either end, but is generally on the user's side.

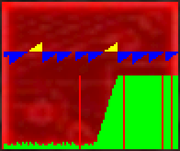
Then you have the yellow. Note that there are two different instances of yellow. The first is in the bottom section, client-side. This indicates that packets are being rejected. You should rarely if ever see this. The second is the server-side yellow. This suggests that the server is dropping the snapshots. As per the first of these two pictures, the server is merely having bad spikes. The second suggests that the server has completely gone off.
Once again, server-side and client-side aren't always entirely set in stone. The client can do things that will result in the server dropping some of their individual snapshots (for example, a negative timenudge value). However, assuming you do not intentionally alter this, that should never appear for anything other than a server-based issue.
{Still a WIP, posting what I have thus far though!}
What's this?
Lagometer is a box on the side of your screen that monitors all lag the player may encounter, both client-side and server-side. The best definition would be to say it measures the amount of delay a player experiences. It can be activated by opening the console and typing /cg_lagometer 1.

Yea, that thing.
It is separated into two main parts, by a blue line that reflects your FPS: The top, which interprets server-side lag, and the bottom, which interprets client-side lag.
What does it mean?
Well, lets start with the basics.

For starters, the green bar is a direct measurement of your ping. Ping, being the speed of information travel from your computer to the server. The higher your ping, the higher the green bar will be. The green bar can be affected by anything that changes the rate at which packets travel from your end to the server's end. This means commands like /rate, /cl_maxpackets, /snaps, /cl_timenudge, /cl_packetdup, and pretty much anything else along those lines. Some of those, like cl_timenudge, will not necessarily alter your ping on the tab list, but will alter your green bar. This is because timenudge alters the way the packets are perceived, not the rate that they are sent and received.
Obviously, then, if your green bar is shaky like that first picture, your connection is choppy. If you experience spikes in this green bar, you are having lag spikes on your end. A high bar means you are encountering high ping, and a low bar means low ping.
Next up is the red bars in the bottom section. Those suggest that the packets being sent are getting lost. You're losing these packets. That usually results from a poor connection with the server; it can be an issue on either end, but is generally on the user's side.

Then you have the yellow. Note that there are two different instances of yellow. The first is in the bottom section, client-side. This indicates that packets are being rejected. You should rarely if ever see this. The second is the server-side yellow. This suggests that the server is dropping the snapshots. As per the first of these two pictures, the server is merely having bad spikes. The second suggests that the server has completely gone off.
Once again, server-side and client-side aren't always entirely set in stone. The client can do things that will result in the server dropping some of their individual snapshots (for example, a negative timenudge value). However, assuming you do not intentionally alter this, that should never appear for anything other than a server-based issue.
{Still a WIP, posting what I have thus far though!}